Two companies of the SUDOP GROUP, GeoTec-GS a.s - dealing with the provision of a wide range of services in geotechnics, engineering geology, hydrogeology, geophysics, remediation geology and building diagnostics and PUDIS - a traditional design, research and engineering company operating in the field of road buildings and urban engineering, turned to us with a request to develop a new system for monitoring and evaluating geodetic measurements of linear structures, such as tunnels and roads.
Outdated method of monitoring the implementation of constructions and risk identification
The client faced a lengthy process for monitoring and evaluating geodetic surveying measurements of linear structures such as tunnels and roads. He needed to develop a system in which construction monitoring contractors can upload to the system the measured data of individual monitored points within the construction, and thanks to this, contracting authorities can check the progress in the construction online and immediately identify potential risks.
Development of a new system for monitoring and evaluation of geodetic measurements in line structures. Implementation in the form of a web client-server application with a central database server.
MVC applications with React components for more complex front-end functionality.
The main development took place from the summer of 2018 to the spring of 2019 with additional modifications until the summer of 2019 and phase 3 at the turn of 2021 and 2022 (connection to GIS). As a solution, we chose the MVC application, in which React components are used for more complex front-end functionalities. The ORM framework Entity framework 6 is used to access the MS SQL database. We used the internal company framework built on top of the ASP.NET Boilerplate.
Intuitive user interface
In terms of user interface, we wanted to maximize simplicity, overall design clarity and modern navigation within the application.
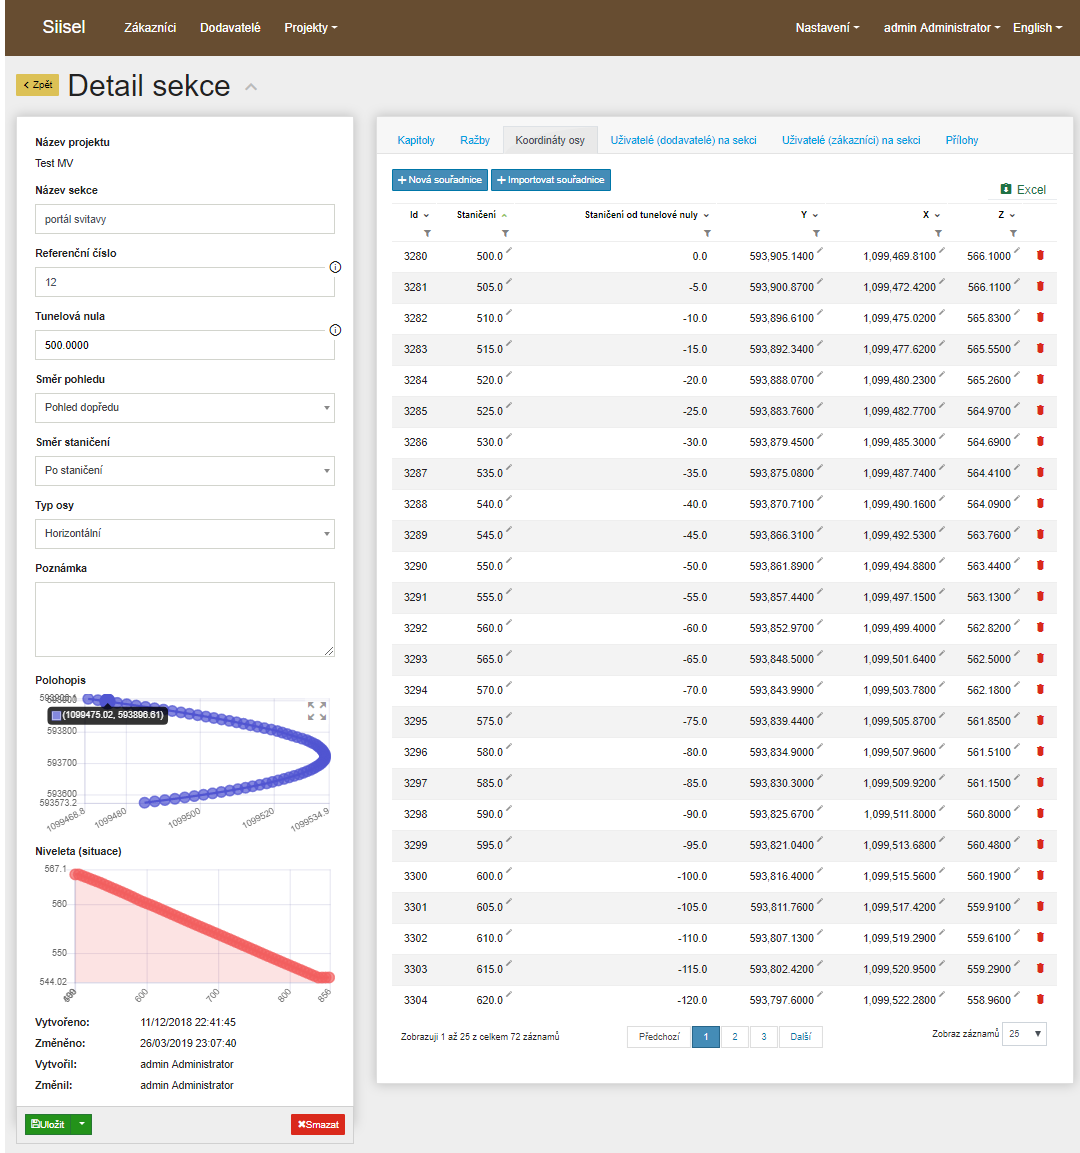
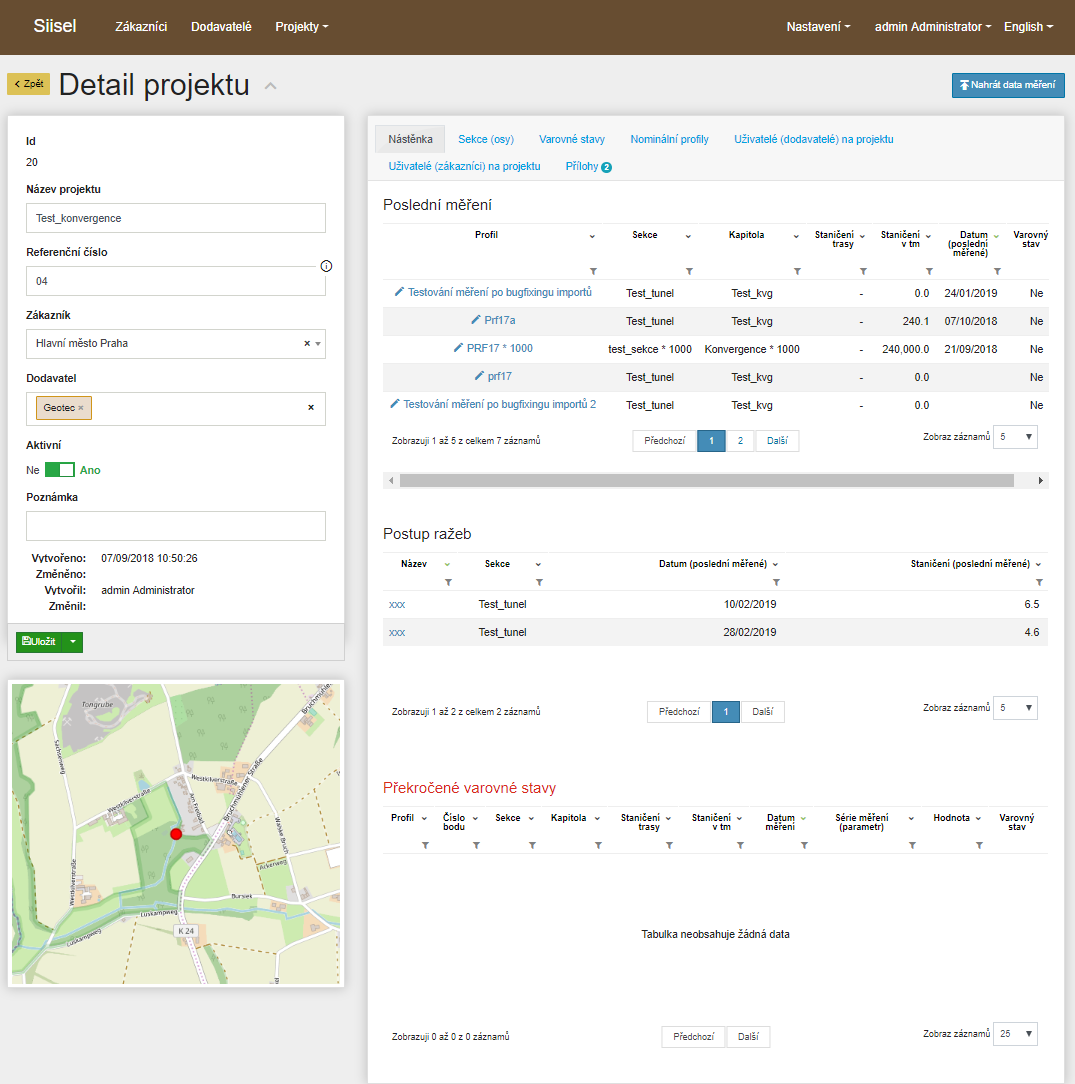
A lot of information is displayed in the form of tables, we used DataTables.net. Graphs from the Chart.js library are used to visualize the measurements. Map display works with freely available OpenStreetMaps.
Comprehensive independent administration
The application includes comprehensive user rights management, which allows you to set access to a specific user for an individual entity, even including the entire hierarchy below it.
The administration of code lists allows you to define your own colors, the shape of nominal points and their use in defining your own nominal profile. Furthermore, you can create your own type of measurement, in which you can define 1+ monitored parameters. This ensures great flexibility and scope of use. In-memory Jobs from ASP.NET Boilerplates are used to calculate convergence measurements. The nCalc library is used to enter and evaluate alert states, thanks to which administrators can enter a specific alert state formula. Project board for monitoring the current state of implementation Thanks to the project board, the client can see the current course of implementation, including any exceeded warning states, or the latest measurements and excavation progress. The bulletin board also contains a map with the location of projects, which is the first step in developing the application in GIS format (all information from the bulletin board is visualized in the map). Last but not least, profile exports to PDF, which are used for project documentation, are important.